A Toolbox for Spatial Computing Experiments
Download
Vuforia Spatial Toolbox
Vuforia Spatial Edge Server
Forum
Join our community: Spatial Toolbox Forum
Getting Started with the Vuforia Spatial Toolbox
Tools
The Spatial Toolbox gives you a set of tools that you can add to your AR environment. Tools are pieces of AR content that can be added, moved around, and combined into spatial computing scenarios.
In this example, we take a graph tool from our toolbox and add it to the world.
Nodes
Each tool can have one or more nodes. Nodes are programmable data points with a spatial location. They can act as an input for a tool, or an output, or both. By linking together the nodes of different tools, we create a data stream from one to the other. This lets us wire a set of tools together into a spatial program.
In this example, we connect a slider tool to a graph tool, so that when we drag the handle of the slider up and down we visualize the data it generates on the graph. This is the simplest example of a spatial program.
Objects
In addition to placing tools so that they “float” in the world in front of us, we can also attach them to specific objects that our Vuforia AR tracker can recognize. These can be as simple as a QR code or as complex as a 3D scan of a machine or larger space.
In this case, we’ve attached some tools to an industrial machine. The AR user interface appears when we approach the machine.
Note: You won’t be able to detect objects like this by default. To do that, you’ll need to learn about setting up a Vuforia Spatial Edge Server and configuring a set of objects on it.
Programming the Physical World
Tools become even more interesting when you bring in the ability to connect their data (their nodes) with things in the physical world. For example, using tools to visualize the data being generated by machines, or using the Toolbox to link multiple IoT devices into an automated process. How can we do this? We can set up certain nodes to read or write data to other systems and hardware, and then link those nodes to our tools.
In this example, the scale has a node for the weight value, which it reads using our Kepware connector. We have linked that node to the node of this tool to visualize how much weight is on it. You can see the UI change as we press down on the table. We then linked the output of this tool to the red light on the corner of the machine, so that the light turns red when the weight is larger than this tool’s threshold.
Again, this feature won’t be available by default if you just download the app. You’ll need to set up a Vuforia Spatial Edge Server and learn how to use Hardware Interfaces.
Navigating the Menus
There are five menu buttons always present on the right side of the screen. Learning what each does will guide you through the interface.
- The Interfaces button displays any AR tools placed into the space.
- The Programming button displays the programming nodes and links for any of the tools you are currently looking at.
- The Pocket button opens a scrolling menu of tools that you can add to the space.
- The Settings button opens the settings menu, where you toggle between different options and modes.
- The Freeze button is a useful feature to pause the video background into a still image, so the AR content doesn’t move when you move your device.
The Basics
Adding Tools
Tapping on an icon in the pocket will add that tool to the space.
You can then tap and hold on the tool for a moment (without moving your finger) to start moving it. Drag to move it horizontally and vertically. Pinch with two fingers to scale it up or down.
In this example, we add a slider tool and a graph tool, and organize them in our space.
Drawing Links
When you switch to programming mode, you will see the nodes for any visible tools.
You can connect any two nodes by dragging a line between them.
This creates a link that will send data from the first node (in this example, on the left) to the second (on the right). The direction matters, so the animated dots move in the direction that data will flow.
Cutting Links
To delete a link, you can swipe through it to cut it.
The node on the left will no longer send data to the one on the right.
Moving Nodes
If you tap and hold on a node for a second without moving your finger, you can then reposition it by dragging it around. Blue corners will appear around the node to show that you can move it.
The position doesn’t affect the behavior, but it can be useful to keep the nodes organized.
Interacting with Tools
Some tools – like the graph – just visualize data. Others – like the slider – are inputs that we can interact with. By linking the input tool to the output tool, we can visualize the data that the input generates.
Before interacting with tools, remember to switch back from the programming mode to the interfaces mode.
Fast-adding Tools

Instead of tapping on a tool’s icon in the pocket, if you tap-and-hold and drag the tool all in one gesture, you will be able to move and scale the tool all at once. This is just a shortcut if you want to quickly add tools to the space.
Linking Multiple Tools
Each node functions both as an input and an output, so you can string together tools’ nodes into longer programs.
In this example, the value from the slider is visualized first by a simple meter, and then gets passed to a time-series graph to be visualized in a different way.
Deleting Tools
When dragging a tool around, a trash icon will appear on the right edge of the screen. Drag the tool on top of the icon and let go to delete it.
This will also delete all links to or from the nodes of this tool.
Logic Nodes
Links just send data between nodes without affecting the data along the way. To add more logic to your system, you can add a Logic Node and pass the data through the logic node.
This part of the guide will teach you the basics of a block-based programming environment that lets you add all sorts of logic to your systems.
Add Logic Node
When you’re in programming mode, dragging out from the pocket button will create a new logic node that you can place into space. There needs to be at least one tool in the space first, for the logic node to attach to, but you can add as many logic nodes as you want.
Link to the Logic Node
Creating a link to a logic node lets you choose a color for it: blue, green, yellow, or red. You can also choose a color for links drawn out of a logic node. The color of this link determines which color-coded entry point it will connect to within the logic node.
In this example, we send the data from the slider into the blue input, and send data from the green output to the graph.
Open the Logic Node
Tapping on a logic node opens its programming grid, where you can construct a program that affects the data flowing from its inputs to its outputs. You can place logic block into this grid, and link them together into programs.
The top row has an input spot for each color, corresponding to the colors of links connecting to this logic node.
The bottom row has an output spot for each color.
Add Logic Block from Menu
Tapping on the pocket button within a logic node opens the logic menu, where you can see a set of logic blocks that you can choose from.
Tap down and drag a logic block to select it. Dragging it around will snap it into different grid spots that it gets close to. Let go of it while it is snapped onto a spot in order to place it.
In this example, we select an inverter block, and place it into the grid.
A full list of blocks, and how to use them, can be seen here.
Link Blocks to Inputs and Outputs

Drawing lines between blocks, input spots, or output spots will create a link. To create a working program, you need to make a path from an input to an output.
Since we connected the slider to the blue input of the logic node, and the graph to the green output, we link the blue input spot to the inverter block, and then link the block to the green output spot.
This will send inverted values from the slider to the graph.
Move Logic Block
Tapping and holding on a block for a second will allow you to pick it up and move it to a different spot. The location you choose doesn’t matter (unless you place it on an input or output spot) but it helps to organize them.
If you place it on an input spot, it will automatically link it to that input. If you place it on an output spot, it will automatically link it to that output.
Logic Block Information

If you tap on a placed logic block (without holding), it will open the information and settings page for that block. For example, tapping on the inverter block explains what the block does. The inverter block doesn’t have any settings that can be changed.
Tapping the back button closes the information. Tapping it again would exit the logic node entirely.
Logic Block Settings
Some logic blocks have settings that you can change by tapping on them.
In this example, we add another block to the grid: a delay block that will output whatever data is sent to it after a certain amount of time. By tapping on the block, we can change that amount of time.
Adjust Block Links
A link between blocks can be deleted in a similar way as those between nodes: just swipe to cut the line.
Blocks can also be linked together, to compose their effects into a more complicated program.
In this example, the data from the blue input first gets inverted, and then gets sent into the delay block. After a few seconds, the delay block will send the inverted data to the green output.
Delete Blocks
When moving a block around, a trash icon will appear on the right edge of the screen. Drag the block onto that icon and let go to delete it (and all the links to or from that block).
Delete Logic Node
Logic nodes can be moved around by tapping and holding on them, just like regaular nodes. Regular logic nodes cannot be deleted, but logic nodes can. Drag a logic node onto the trash icon on the right edge of the screen to delete it and the links connected to it.
Additional Services
The Vuforia Spatial Toolbox supports a variety of additional services that you can use to view and spatially interact with content in a variety of ways.
Visibility Distance
One service included in your app is the ability to set from how far away a tool will be visible before it fades away. By default, tools will hide when you are more than 2 meters away from them, but this can be adjusted.
When holding on a tool so it can be repositioned, if you press and hold another finger on the green distance icon in the bottom right a blue sphere and dotted line will appear to show you how far this tool can be seen. As you walked towards or away from the tool, the size of the sphere will match your current distance. When you let go, it will set the visibility distance to your current distance. As you step further away, the tool will fade away, but it will reappear as you walk closer.
Grouping
One service that isn’t enabled by default, but can be useful, is grouping. If you’re a developer, you can build new services like grouping and add them to the app using the addon system.
Turning on Grouping Mode

To enable the grouping service, open the settings menu and turn on the toggle switch for Grouping.
Grouping mode lets you form groups of tools that you can move together in space.
Using the Grouping Lasso

If grouping mode is turned on, double-tap on the background and draw a circle. This is your grouping lasso. Any tools inside this lasso will be grouped together when you let go.
Grouping and Moving Tools
In this example, we draw a circle around two tools to group them together. Now when we move one of them around it will also move the other relative to it.
To ungroup tools, draw a lasso around them again.
Deleting a Group
If you delete a tool in a group it will also delete all other tools in the same group. This can be a useful way to delete a lot of tools at once.
Envelopes
Envelopes are a special type of tool that can contain other tools. They help us organize the space. Think of them as a way to put your other tools into boxes that you can open and close.
If you’re a developer, you can build your own types of envelopes, but by default there is one envelope tool that you can use.
Adding an Envelope
This blue icon represents the envelope tool. Add one to your space and tap on it to open it. When it is open, you’ll see a blue [X] icon in the top left corner.
Adding Tools to an Envelope

While you have an envelope open (you can see the [X] in the corner), all compatible tools that you add from the pocket will get added to that envelope. Here, we add two buttons to this envelope. When we press the [X] button, it closes the envelope. This hides all the tools that we put into it.
Reopening an Envelope
Tapping on an envelope reopens it, displaying all of the tools we put inside it.
Multiple Envelopes
You can only have one envelope open at a time. Tapping on another envelope when one is already open will close the first one before opening the second.
In this example, you can see how we use two envelopes to better organize a space with many tools.
Tools inside an envelope are not “grouped” like those using the grouping lasso – they do not move relative to one another. Grouping and envelopes are two different examples of services you can use to form different kinds of spatial relationships between the tools in your space.
Developer Features
Viewing Found Objects

You may wish to see or debug which objects have been discovered by this client. To do so, open the settings menu and tap on the Found Objects button. It will open a page that shows an entry for each object discovered by this app.
You should always see an entry called “_WORLD_local”, representing a local world object that your AR content will attach to by default. Additional entries will only appear if you are running additional Vuforia Spatial Edge Servers in your network.
Each object will display the IP address of the Edge Server it is being hosted by, and the list of tools that have been attached to it.
If an object name appears in red, that means that the Vuforia Engine was unable to initialize an AR target for that object using the data hosted by the Edge Server, so you won’t be able to recognize that object in your space and see its AR content. Object names appearing in black have been successfully added to the AR tracker.
Creating Objects on the Edge Server
In addition to adding AR content that floats in space, Vuforia Spatial Toolbox lets you attach AR content to physical objects. AR content will “stick” to this object as it moves around. Also, tools attached to an object can make use of Hardware Interfaces to read and write data to things in the physical world, such as an Arduino, a Lego robot, or an industrial PLC.
Creating an object is easy. Just run the Vuforia Spatial Edge Server, open up its interface, and click the “Add Object” button. Give it a name and drag-and-drop a JPG image onto it to set its target. The “Add Tool” button can be used to give it some customizable AR content that will appear when you look at that image with the Vuforia Spatial Toolbox app, and you can add more tools to it from the Pocket menu in the app.
Connecting to Hardware
The “Manage Hardware Interfaces” tab of the Edge Server will show you a list of all the Hardware Interfaces you currently have installed on this server. By default, your server only has the Kepware interface for connecting to industrial machines, but you can download more integrations from the Add-ons page. Some hardware interfaces can be configured with additional settings, for example the IP address or authentication credentials for the corresponding IoT gateway. Most hardware interfaces will automatically generate and configure Toolbox objects based on the physical devices they detect. You’ll then be able to attach target images to them in the Object Configuration tab and see their datapoints as nodes in the Spatial Toolbox.
Extending the Platform as a Developer
Vuforia Spatial Toolbox is an open source platform that is meant to be extended. To do so, we have the concept of an Add-on that anyone can build to add new components and functionality to the system.
The Vuforia Spatial Edge Server has an addons directory that can contain any number of add-ons. Each add-on can contain any combination of the following: tools, hardware interfaces, node types, logic blocks, and feature scripts.
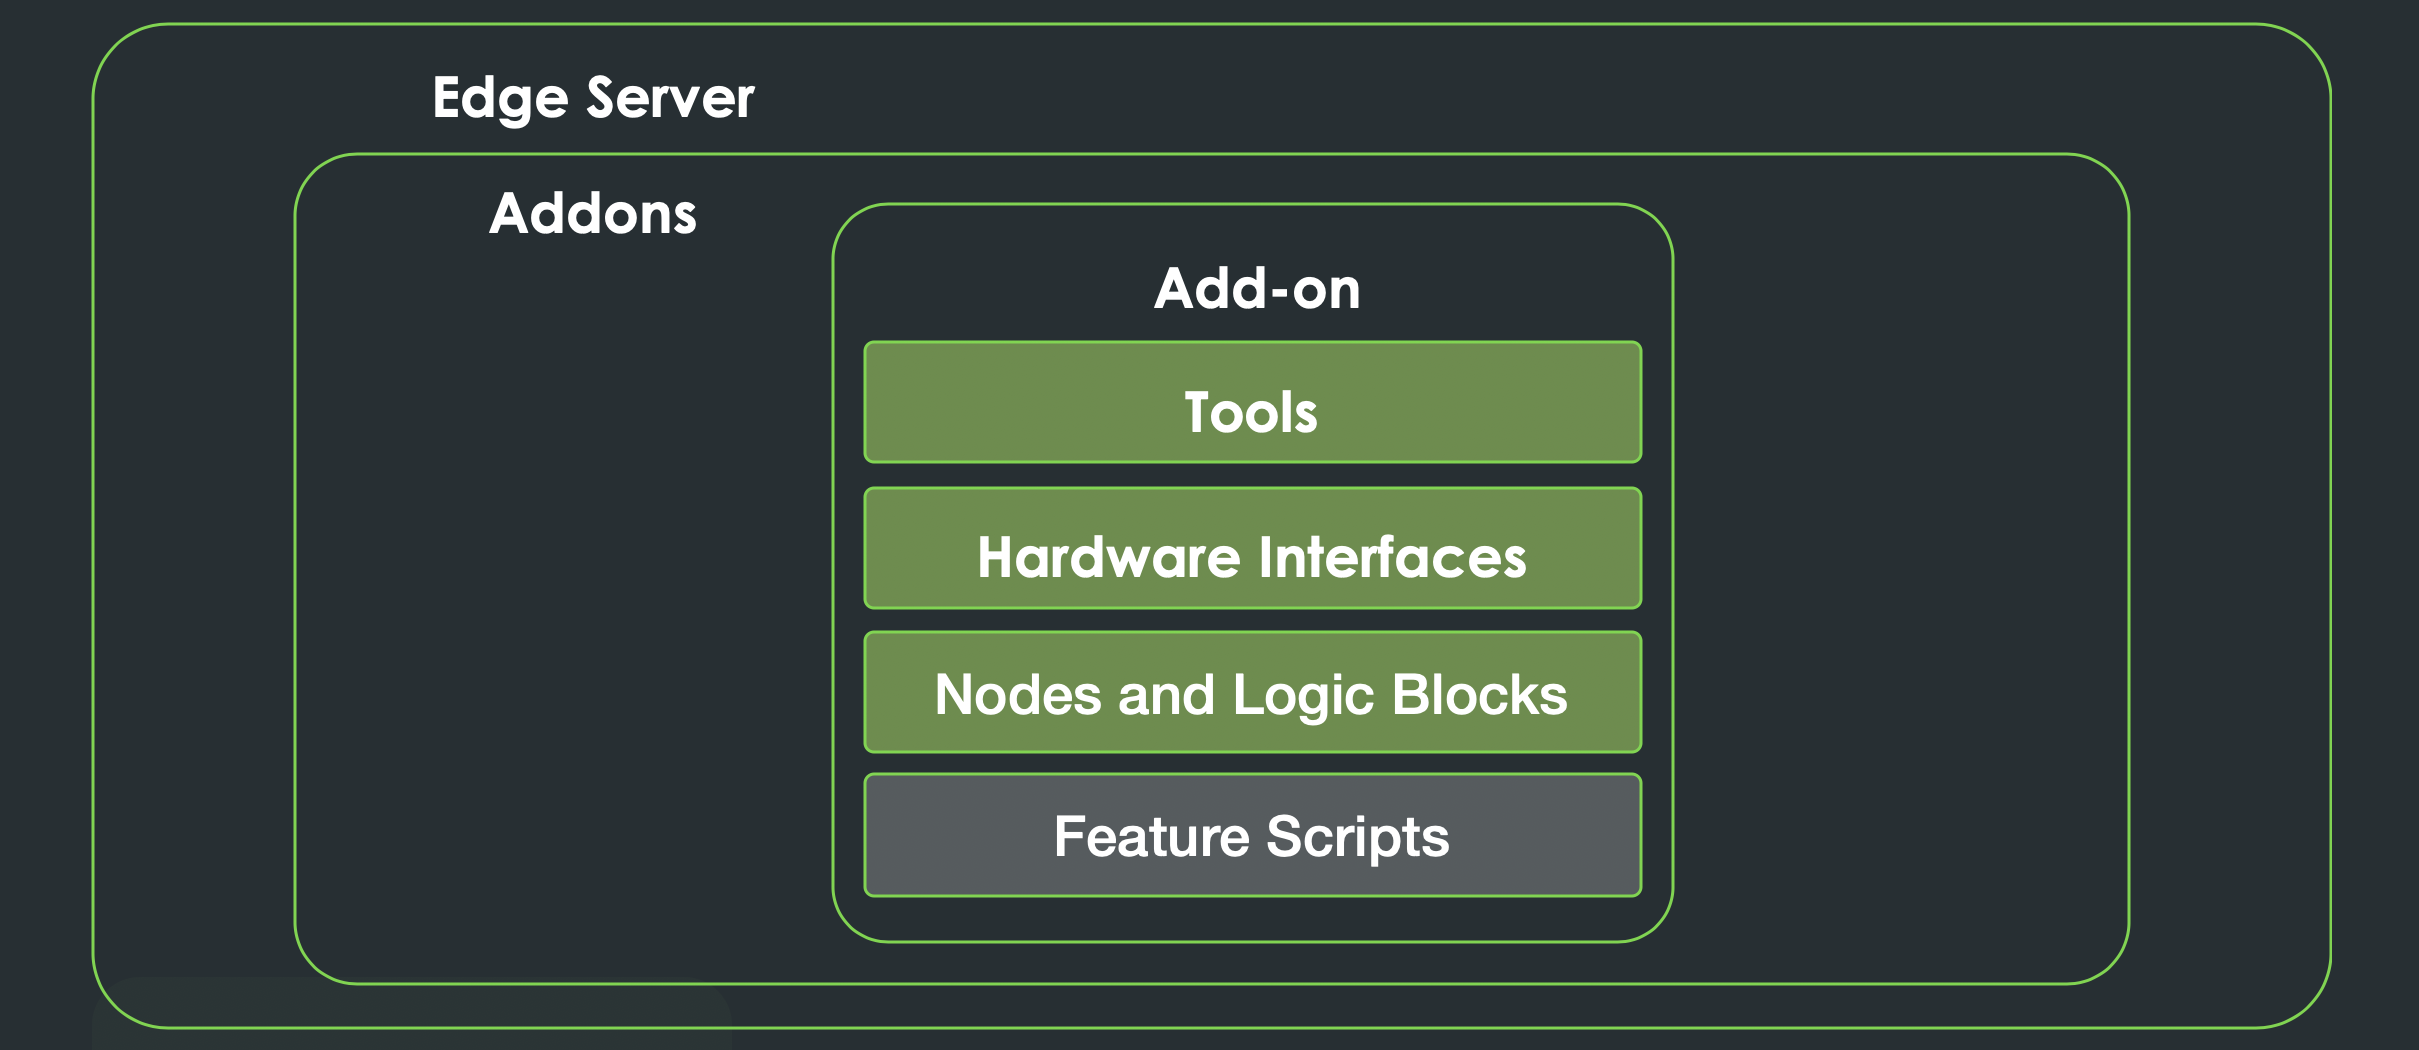
Hardware interfaces will appear in the Edge Server interface. Tools will appear in the Spatial Toolbox app’s pocket menu while you are looking at any objects hosted by your server. Logic Blocks will appear in the logic block menu if the logic node is attached to an object hosted by your server. New node types don’t appear in any menu, but can be utilized by your tools when you develop them.
Feature Scripts are an advanced type of add-on that lets you directly customize the Spatial Toolbox app code in a powerful way. And if anything you want to build doesn’t fit into an add-on, you can directly modify and collaborate on the open source projects for the Vuforia Spatial Edge Server and Vuforia Spatial Toolbox on GitHub.
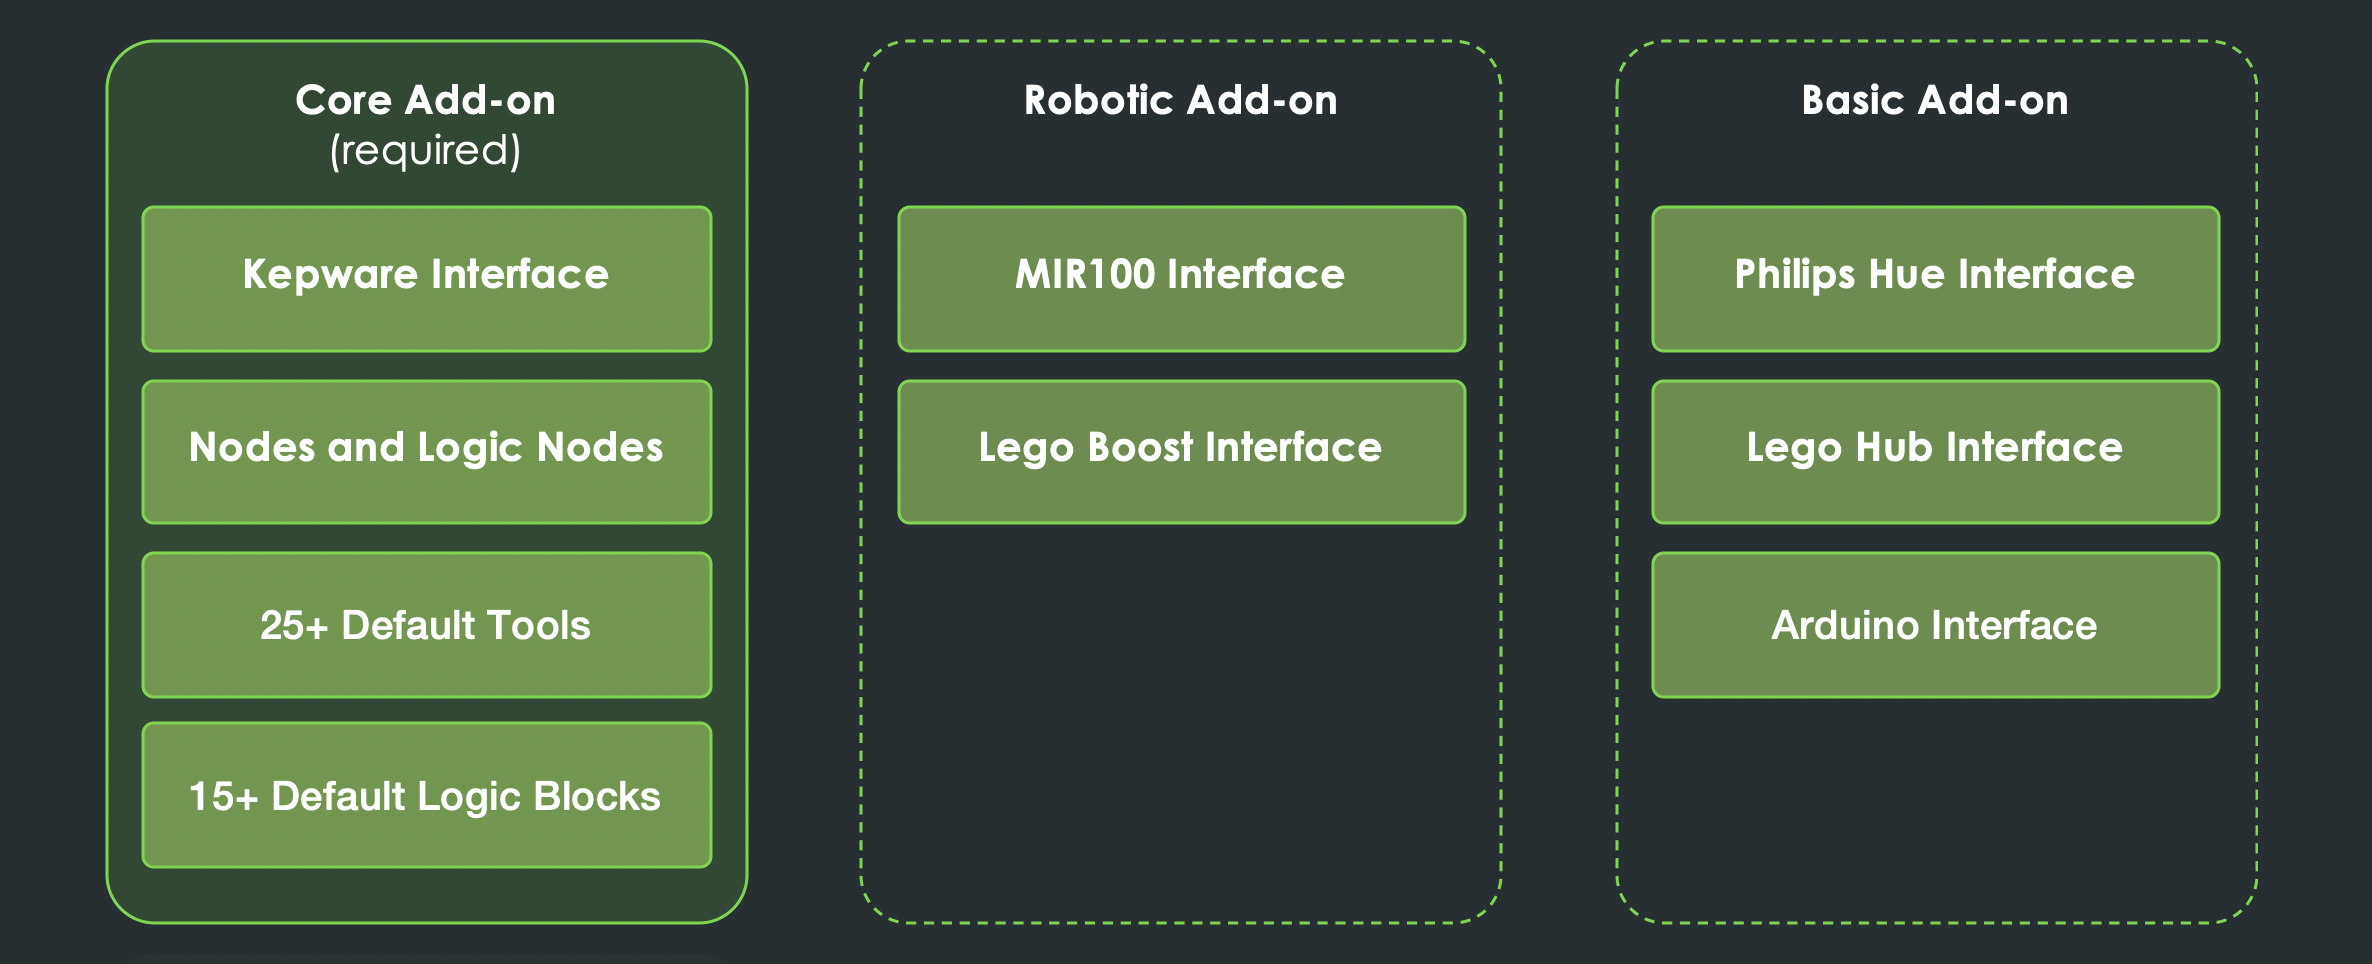
So far, the following three add-ons have been developed and are being maintained. We welcome your contributions to these add-ons, and encourage you to create new add-ons that push the platform in new directions.
Getting Involved with the Community
Vuforia Spatial Toolbox is an open source project, licensed under MPL 2.0, and we encourage you to join our community and contribute to the project in whatever way you can. Anyone is welcome and encouraged to be a part of our community, whether you’re a student looking to learn about Augmented Reality and Spatial Computing, a hobbyist looking to experiment with some DIY projects, an innovation engineer looking to use this in your industry, or a researcher looking to push the boundaries of this platform even further.